The Volume Profile On Live Charts
This is the applied half of Saint's two part volume profile series. Part one covered the components and the theory behind each shape; this one puts all five on live charts and shows what marking them up actually looks like, including the judgement calls that do not fit on a slide.
The rule running through every page is that a level is not a signal. The profile picks the price, and something else, absorption on the DOM, exhaustion, a footprint read, has to give permission before it becomes a trade. Two of the examples are deliberately imperfect: he could not find a clean trending profile and says so, and the B-shaped example did not continue the way the textbook read suggests.
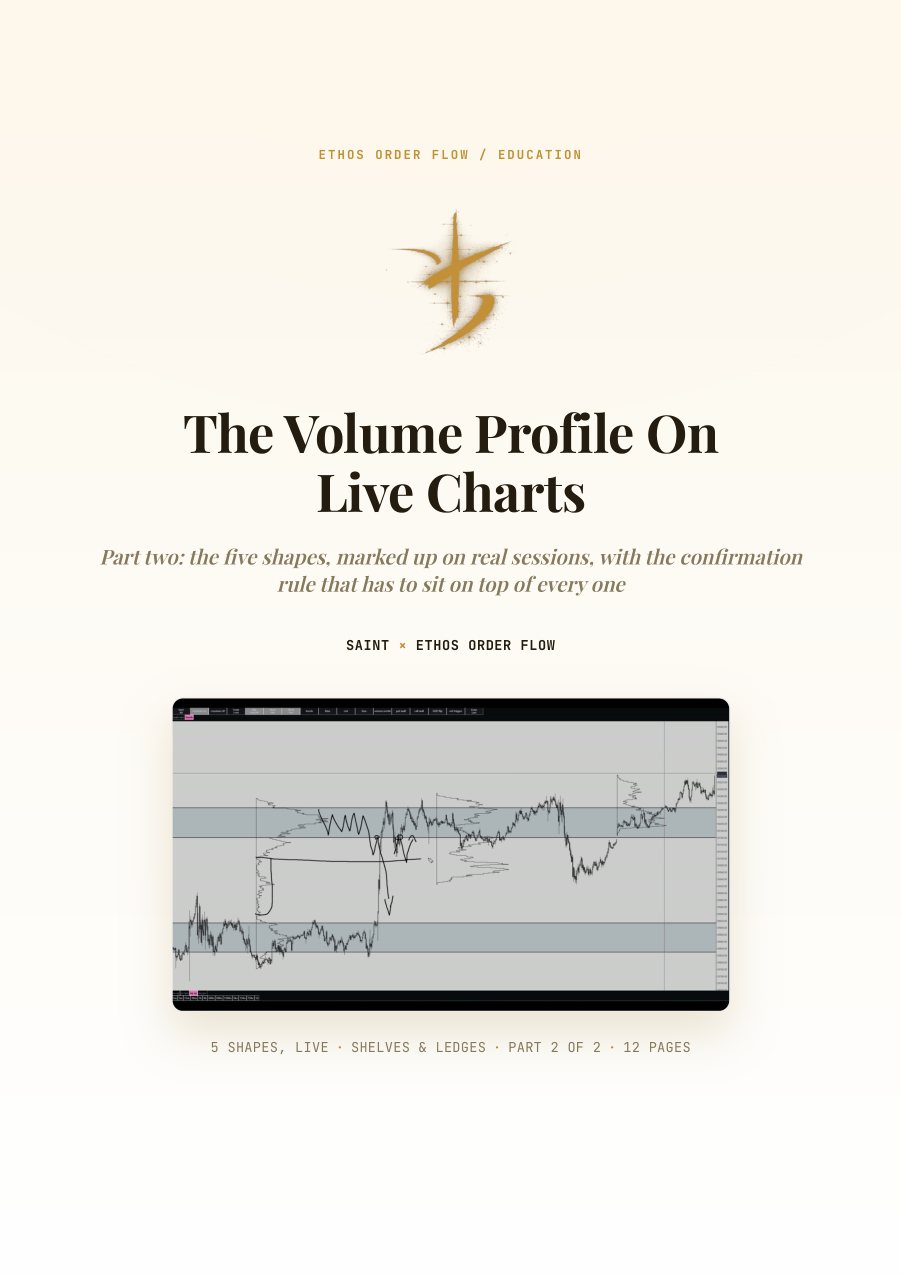
The video this comes from
The Volume Profile On Live Charts
Watch the video for the live walkthrough. The PDF is the same material structured for study, with every chart and level labelled.
Inside the PDF
- Levels are not signals: the rule on top of every shape
- The balanced profile, live, and why the extremes keep holding
- Shelves and ledges: the taper that tells them apart
- The double distribution, with the low volume gap
- Trading the break and retest, and the failure that flips it
- The trending profile, and the data behind sitting out
- The P-shaped profile
- The B-shaped profile, and the example that did not work
- The checklist: every rule in the document, printable
Enter your email, the PDF downloads instantly.